Positions, Profit and Loss

In the previous article we discussed the structure of order books, and the mechanics of trading. Today, I want to go through what happens after those trades occur. Primarily, how we keep track not only of what we’ve traded, but how much profit we’ve earned or losses we’ve accrued by doing it. As before this is very much an introductory guide, so seasoned professionals may wish to skip.
Brokers and Exchanges
Whatever your trading platform of choice, fundamentally they all seem to do the same thing. They let you trade, and they will manage your money, stocks, crypto, etc. From your perspective it all seems quite simple, you click buy or sell, and the securities or crypto appear in your account. The reality however can be more complicated than it seems, and we will briefly cover this topic as a backdrop to the technical aspect of managing positions.
Traditional Exchanges
An exchange is a venue where securities can be bought or sold. An exchange will facilitate trading by listing shares, contracts, etc and hosting the order books required to trade these. Exchanges will provide connectivity which is a generic term for the ability of market participants to be able to connect and place orders as well as receive responses to these orders. They will also provide a public facing data feed for trades, and price updates. This is commonly referred to as just market data. These days this is almost entirely electronic, with communication going over a network. For most exchanges that is essentially all they do.

The New York Stock Exchange (NYSE), Hong Kong Stock Exchange (HKEX) and the Australian Chi-X are all examples of traditional exchanges.
In traditional markets (stocks, bonds, etc) the general public rarely has access to exchanges. Generally larger firms and specialist institutions trade on them, and onboarding on one of these exchanges requires various legal arrangements, as well as a non trivial technology set up. Nevertheless, regular investors can still get access to an exchange via an intermediary firm which we will cover in the next section.
Traditional Brokers
A broker is (typically) a firm that allows regular investors to gain access to various markets in order to buy and sell securities. In order to do this, a broker must be a participant with each exchange that they want to trade on. When a client wishes to purchase a stock, the broker may route that order to the exchange on behalf of the client. In addition to this, there are various “value-add” services that brokers can provide to clients. These can include, but are not limited to:
- Providing market data and order book information to clients so they can see prevailing prices.
- Expose a user friendly trading interface to clients which is easy to understand and gives them access to multiple exchanges and markets (most retail clients will have neither the stomach nor the funds for setting up the infrastructure required to connect to an exchange).
- Provide a way for clients to deposit funds so that they can trade.
- Take custody (ownership) of securities clients purchase, and manage things such as dividends, voting, etc. Expose this to clients so that they can see what they own, and how much it is worth.
- Provide margin (a loan) so that clients can trade more shares than they have ready cash for.

TD Ameritrade, RobinHood and Interactive Brokers are all examples of traditional brokers.
For most people, using these brokers will be something that they will be quite familiar with, even though the actual trading of their shares will happen somewhere in the background. Brokers in fact do not always have to go to an exchange directly, and many will route (send) client orders to various third parties such as market makers or other brokers. This was made quite apparent in 2020 when it was noticed that the broker RobinHood was selling client order flow (client orders) to the hedge fund Citadel.
Crypto Markets
What is readily apparent in crypto markets right now, is that nearly all of the major crypto platforms are in fact both of these entities in one! While they are called exchanges, they are also most certainly brokers as well. Take Binance for instance. They offer a way for you to get your funds and crypto into their system, they manage and take custody of your coins and contracts that you own, and they wrap it all up in a web interface that can be used by regular clients all over the world. When it comes to trading, they also provide the markets! Binance has hundreds of coin pairs, each with their own order books matching trades for customers. As such, they have both the features of a broker and of an exchange.
Time will tell how this all plays out. At the time of writing there are already signs that this rather novel model is starting to morph into its predecessor. Crypto pairs are now available on several (newer) brokers such as eToro and RobinHood, and even the Chicago Mercantile Exchange (CME) now lists Bitcoin futures for trading.
Settlement
When you go on your broker’s app and purchase some shares, you will see immediately that you are now the owner of said shares. In reality however, despite having bought the shares, you are not yet the owner of record for them. That means for instance you will not get the dividends that are paid out on that stock, nor can you vote with them. In the US, ownership of shares is transferred at T+2 or in other words, two business days after the trade occurred. Settlement here refers to the act of exchanging the security you bought for the cash paid.
In crypto things are a little different. Many novice blockchain enthusiasts are surprised to find out that when they buy bitcoin on an exchange, they do not in fact have custody of it in “their” own bitcoin wallet. Though they own it in a legal sense, all it is is a record in the exchange’s database. To transfer the coins to a wallet they own (physical ownership) they must first withdraw their coins from the exchange. The actual trades however, all happen within the exchange itself, and pretty much never touch the blockchain (primarily as this would be too slow for normal trading).
Exchanges losing track of the amount of physical and “virtual” bitcoin (the numbers in the database) has in the past resulted in some outrageous losses for various clients (I highly recommend this video). As with anything in crypto, it is always worth keeping in mind the maxim: not your keys, not your coins.
Distributed Exchanges or DEXs are a different type of exchange that exists purely on the blockchain, and where trades are indeed done on chain and settled immediately. These have some interesting mechanisms for trading, though due to blockchain transaction speed constraints their throughput is currently quite low. Some examples of these are Uniswap and PancakeSwap.
Positions and Direction
Investopedia defines a position as:
…the amount of a security, asset, or property that is owned (or sold short) by some individual or other entity. A trader or investor takes a position when they make a purchase through a buy order, signaling bullish intent; or if they sell short securities with bearish intent.
A position therefore can be the ownership of just about anything. If you buy a house you are long the housing market, since you now have a position in a house. If you earn your salary in US Dollars and keep your money in a bank account, you are long however many USD you have. That might not matter to you now, but think about if you wanted to live in the UK and needed to move all of your assets there. Suddenly the exchange rate (the price of pounds in dollars) becomes quite important. As mentioned in the definition, a position can either be long or short. This is sometimes referred to as the direction of the position. This concept can be quite nuanced, but we will try and keep it simple here.
Long Positions
A long position is a position where you have bought something and hold it. In general a long position is profitable if the price goes up, and is unprofitable when the price goes down. A simple example is purchasing stock in a company. If the stock price goes up, your stock is now worth more because you can sell it at a higher price (for a profit). If the stock price goes down, your stock will now be worth less because you can only sell it for a lower price (for a loss).
Short Positions
A short position is a position where you have sold something short. This can mean a variety of things, depending on what kind of financial instruments you are trading. Short selling is normally associated with the stock market, in which a trader is able to take a position in a way that they will be profitable if the stock goes down in price, rather than up. Conversely, if the price goes up for a short position, the position will be unprofitable.

Yes. That’s what it was referring to.
In order to be able to sell a stock short, it requires a few steps:
- Borrow 100 shares from someone who already owns them (such as a broker). Doing this normally costs you some money in interest for however long you borrow them for.
- Sell those shares in the market at the prevailing price, let’s say \$50. This leaves us with 100 * \$50 = \$5,000, and no shares.
- We still need to give those shares that we borrowed back though. Let’s say the price drops to $45. We buy 100 shares from the market, paying 100 * \$45 = \$4,500.
- We give the 100 shares back, and we are left with \$5,000 - \$4,500 = \$500 of profit. Even though the price went down, we made a profit.
It’s not just stocks though. You can go short in a variety of different instruments and securities, depending on how they behave.
Opening and Closing
If you have no position, the act of buying or selling something short is called to open a position. As mentioned before, you will open your position in a particular direction (either long or short). If you have an open position, buying or selling more in the same direction (eg. buying more with a long position) is called increasing your position.
Conversely, if you have an open position and you buy or sell in the opposite direction, then you are said to be reducing your position. If you reduce enough that your position is now net zero (ie. you sold the same amount as your long position), that is called closing a position. If you have no position because you closed an existing position out, you are considered to be flat in terms of your position.

A visual representation of long and short positions, and how to trades affect them.
Every time you trade, you will change your current position. Buying 10 shares while having a long position of 100 will increase your position to 110. Selling 20 shares afterwards reduces your position to 90. In general, you only have one “net” position for a security, meaning that as you trade more, your position will go up and down based on what you did.
Applying Trades to Positions
Given that we have a position (even a flat one), we can “apply” trades to the position in order to get a new updated position that accounts for this trade. For those more mathematically inclined, given a position $P_{current}$ and a trade $t$ and an application function $f$ we get the following expression:
$$ f(P_{current},t) = P_{new} $$
In other words, applying a trade to a position gives us another (different) position $P_{new}$. If we have many trades, we keep applying these trades using the resulting position as the input for the next trade. At the end of all of this, we end up with a final position that represents all of the trading that we did.
Each position is made up of several different values that all tell us something about the position. In the following sections we will outline what each of them mean, and how they can be calculated.
Quantity
As mentioned, a position can either be long or short (or flat). This can be represented by a single number, which will refer to the amount of securities that you own, and whether you are long or short on them. If a position is long, the quantity is positive. If it is short, the quantity is negative. If the position is flat (no position) then the quantity is 0.
This turns out to be mathematically quite nice when it comes to various calculations, as we will see later. For instance if you own 100 shares, your position quantity is 100. If you are short 100 shares your quantity is -100, and if you have no position it will be 0.
As you will recall, whenever you trade with someone this will result in two trades. The exchange’s public trade feed will publish the trade for the side that was aggressive, however both participants will receive a message saying that they made a trade. These private messages are normally called executions and they can be viewed as more detailed private messages for exchange participants. There will be one execution for you, and one with the opposite side for your counterparty (the participant you traded with). From now on however, we will refer to these as trades for simplicity since they essentially represent the same thing.

Clients A & B trade on an exchange. A buys 100 shares at \$90, and B sells 100 shares also at \$90. The exchange notifies each of them individually via an execution.
Calculating your total quantity from a series of trades is quite simple. Each trade comes with both a side (buy or sell) as well as a quantity and a price. To get the final quantity of a position from a series of trades, we simply add up all of their quantities, multiplied by the sign of the side. The sign is normally 1 for a buy, and -1 for a sell trade.
$$ Quantity_{new} = Quantity_{current} + \sum_{t}^{trades}sign_{t} \times quantity_{t} $$
For example, let’s say we have a small short position with a quantity of -100. We make three trades like so:
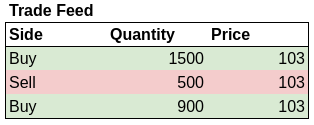
Our total quantity ends up being as follows:
$$ Quantity_{new} = -100 + (1*1500) + (-1*500) + (1*900) = 1800$$
After these three trades, our total quantity for our position is 1800.
Cost Basis
The cost basis is a number that represents the total cost of the position. If the number is positive, that means that you paid money to acquire the position (it cost you something). If the number is negative, that means that you received money on the position (the opposite of cost). This may be initially counterintuitive but knowing the sign is useful for figuring out what the cash element of your position looks like.
If you are increasing the position, and given a set of trades, your total cost basis is the sum of the total cost of each trade. Remember, the cost has a sign and in this case we get the sign from the side of the trade, just like we did with the quantity. A buy has a positive cost, while a sell has a negative cost.
$$ Cost_{new} = Cost_{current} + \sum_{t}^{trades}sign_{t} \times quantity_{t} \times price_{t} $$
As an example, consider a flat position (0 cost basis), and the following buy trades:
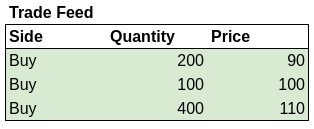
Our cost basis becomes:
$$ Cost_{new} = 0 + (1*200*90) + (1*100*100) + (1*400*110) = 72,000$$
In other words, to acquire our position of 700 shares, it cost us \$72,000.
For a series of sell trades, the procedure works the same:
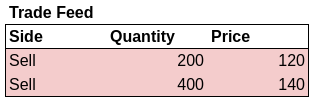
$$ Cost_{new} = 0 + (-1*200*120) + (-1*400*140) = -80,000$$
For the sell trades, we are net short (our position quantity is negative) 600 shares. Our cost basis is -\$80,000 meaning that we have received that money from having this position. So in total, we have a short position of 600 shares, and \$80k in cash that we got from selling the shares that we borrowed (it is illegal to sell without borrowing first, which is called naked short selling).
Average Entry Price
Given a position with a certain quantity, and a cost basis. The average entry price represents what was the weighted average of the prices of the trades that got you into the position. It is a value that at a glance tells you on average what price you got into a position at. Astute readers might note that the weighted average price of the trades actually is just the cost basis divided by the position quantity:
$$ AvgPrice = \frac{CostBasis}{Quantity} $$
Consider the following trades:
Using the previous calculations, our cost basis is \$51,000 and our position quantity is 500 contracts. Therefore, our average price is $\frac{\$51000}{500} = \$102$.
For a short position the situation is the same. Assume we have an identical but short position with a cost basis of -\$51,000 and a quantity of -500 shares. Our average price is $\frac{-\$51000}{-500} = \$102$ which is the same entry price. Notice that the negative signs on the cost basis and quantity cancel out giving us a positive price in each case.
Realised PnL
In the examples above we only looked at what happens to our cost when we only increase our position. But what happens if we reduce our existing position by making trades in the opposite direction? By reducing our position, not only are we decreasing our quantity and cost basis, but we are also potentially realising profit or loss. In trading the term PnL or P&L is common shorthand for Profit and Loss.
A realised profit/loss is a profit or loss which you have actually acquired in cash just from trading. The quintessential example is the idea of “Buy Low, Sell High”. Breaking down that phrase it is essentially opening a long position, and then reducing (or closing) it at a higher price. The resultant profit is your realised pnl, and the general formula for calculating it is as follows:
$$ RealisedPnl = Quantity \times (Price_{exit} - Price_{entry})$$
Where $Price_{entry}$ is the price you entered the position at, and $Price_{exit}$ is the price that you sold the position at. Mathematically, if your PnL value is positive it is a profit, and if it is negative it is a loss.
How you calculate realised profit however is actually more complicated than it might first seem. A key reason for this is which inventory valuation method you use. This can be illustrated by the following example. Consider the following two sets of trades:
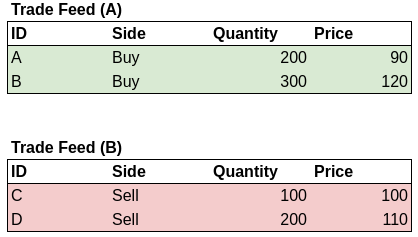
For the first set (A) we create a long position with 500 contracts, with a cost basis of \$54,000 and an average price of \$108. Now we need to execute the second set of trades (B) which are all sells. We know that once these trades execute, we will be left with a position quantity of 500 - 300 = 200 shares. But how much money will we make by selling these shares?
Interestingly, it depends on which of our shares we plan to sell. Recall that we bought in two trades at two different prices. If we consider each of these trades to be separate, we will get a different profit depending on which ones we sell. In fact, there are several inventory valuation methods that are used for calculating this:
First In First Out (FIFO)
In this method, we sell our shares in the order that we acquired them. We take each sell trade, and match it against our buys in the same order in which they were bought. We calculate the profit on each one, and adjust the cost basis as well. In this case, we first match trade C against trade A. We make a profit of 100*(\$100-\$90) = \$1000, and we reduce our cost basis by the amount we sold at the original price, so 100*\$90 = \$9,000.
The second sell trade (D) is more complicated because we need to match the 200 shares across the remaining 100 shares of A, and 100 shares of B. So the total profit from this is (100*(\$110-\$90)) + (100*(\$110-\$120)) = \$2000 - \$1000 = \$1000 profit. We also reduced our cost basis by (100*\$90) + (100*\$120) = \$21,000.
Our final position is 200 shares, with a cost basis of \$24,000 and a realised pnl of \$2,000.
Last In First Out (LIFO)
This method is essentially the opposite of the FIFO method. Here, we sell our shares in the reverse order of their acquisition. We first match the sell trade C against B, which results in a net loss of \$2,000 and a reduction in the cost basis of \$12,000. Trade D fully sells off the C trade, also with a net loss of \$2,000 and a reduction in cost basis of \$24,000.
In total, we end up with a realised pnl of -\$4,000 (net loss), and a position of 200 shares with a cost basis of \$18,000.
Average Cost
This method averages out the costs of the trades and uses average prices to calculate the realised pnl. As mentioned earlier, our 500 share position has an average entry price of \$108. We take a look at the sell trades that we made, and aggregate them together to create an opposite short position. In this case, trades C and D when combined create a short position of 300 shares, with an average price of \$106.666. Note the recurring decimal on the price.
We treat the two positions as one trade. Our realised pnl is 300*(\$106.666 - \$108) = -\$400, and our cost basis for the remaining 200 quantity position is \$54,000 - (300*\$108) = \$21,600. Notice that this method is a lot simpler than the other two, but because you have to use average price, you are exposed to floating point imprecision which is a lack of accuracy that computers have when computing decimals. If this average price calculation is done enough, it can result in errors building up over time.

Those familiar with the 1999 film Office Space may remember floating point imprecision being used as a plot device
Carrying out this method without being exposed to the risk of floating point imprecision is left as an exercise for the reader.
Comparing Methods
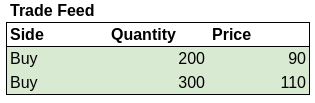
We note that the difference in realised pnl between these three methods is quite large. In the first we made a profit (\$2,000), in the second we made a large loss (-\$4,000), and in the third we made a smaller loss (-\$400). While this may seem slightly crazy, it actually makes sense since all these different methods do is realise PnL earlier or later. The end result however, is always exactly the same. We can prove this by fully closing the position. Let’s say we make one more trade:
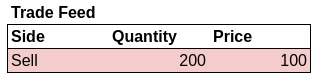
After this trade, our 200 share long position is now flat, we have no more shares. If we apply the same methods above, what do we end up with?
- First In First Out
- The profit on the final closing trade is 200*(\$100-\$120) = -\$4,000. This gives us a final loss of \$2,000 - \$4,000 = -\$2000.
- Last In First Out
- The profit on the final closing trade is 200*(\$100-\$90) = \$2,000. This gives us a final loss of -\$4,000 + \$2,000 = -\$2000.
- Average Cost
- The profit on the final closing trade is 200*(\$100-\$108) = -\$1,600. This gives us a final loss of -\$400 - \$1,600 = -\$2000.
As you can see, once we fully closed the position all of them achieved the same final realised pnl for the same set of trades. This behaviour of realising profits earlier or later can be useful for companies, for instance when they wish to post a capital gain earlier or later. In certain cases the choice of method can be beneficial for tax, or yearly results, etc.
Mark Value
A position normally will have some sort of valuation attached to it, ie. how much is this position worth right now at current market prices. Generally this is done by a technique called mark to market or MTM. With this technique, a certain mark price is assigned that represents that fair value of whatever security we are valuing. How the fair value of something is calculated depends on what that thing is. Stocks commonly use the last traded price or last price as the mark price. Derivatives such as futures or swaps use other more complicated methods that take into account their various peculiarities and underlying instruments.
Fundamentally the mark price is meant to represent what that asset is actually worth. Sometimes this can be hard to determine, especially if the market for that asset is disorderly ie. it is not behaving correctly due to high fear or uncertainty, and prices are chaotic.
If we know what the mark price is, we can use it to place a monetary value on our position which is called the mark value. We can calculate the mark value by simply multiplying our position quantity by the mark price:
$$ MarkValue = Quantity \times MarkPrice $$
For example, let’s say we have a 600 share long position, and our mark price is \$110. Our mark value will therefore be 600 * \$110 = \$66,000.
What if we have a 700 share short position, with a mark price of \$90? Our mark value will be -700 * \$90 = -\$63,000. Notice that the mark value is negative, as this is a short position.
Unrealised Pnl
As covered earlier, our cost basis is the cost that we took to enter our position, and the current value of our position right now is the mark value. Therefore we can calculate the theoretical profit or loss that we could get by closing this position at a fair price. This theoretical profit or loss is called the unrealised pnl. It is unrealised, because we have not realised it yet by closing the position. Sometimes this is also called a paper profit/loss because “it is only on paper”. It can be expressed as
$$ UnrealisedPnl = MarkValue - CostBasis $$
For example, let’s say we have a 500 share long position with a cost basis of \$50,000 and therefore an average entry price of \$100. What is our unrealised pnl at different mark prices?
- Mark price is \$120
- Our mark value is 500 * \$120 = \$60,000. Our unrealised pnl is \$60,000 - \$50,000, so a net \$10,000 unrealised profit.
- Mark price is \$90
- Our mark value is 500 * \$90 = \$45,000. Our unrealised pnl is \$45,000 - \$50,000, so a net -\$5,000 unrealised loss.
How about a 600 share short position, with a cost basis of -\$54,000 and an average price of \$90? Make sure to pay attention to the double negatives (-)!
- Mark price is \$110
- Our mark value is -600 * \$110 = -\$66,000. Our unrealised pnl is -\$66,000 - -\$54,000, so a net -\$12,000 unrealised loss.
- Mark price is \$80
- Our mark value is -600 * \$80 = -\$48,000. Our unrealised pnl is -\$48,000 - -\$54,000, so a net \$6,000 unrealised profit.
Glossary
- Average Entry Price
- The quantity weighted average of the prices of the trades that you carried out to get a position.
- Broker
- An entity that offers access to markets, as well as various other ancillary services.
- Close (a Position)
- To reduce a positions quantity so that it is 0.
- Connectivity
- A general term for electronic and network connections to an exchange or broker.
- Cost Basis
- The total cost in cash to enter a position.
- Counterparty
- The opposite participant in a trade
- Custody
- Ownership of assets, eg. stocks, crypto, etc
- Direction
- Whether a position is long or short.
- Disorderly Market
- A market where the fair price of an asset is difficult to determine due to adverse factors such as uncertainty, or loss of liquidity, etc.
- Distributed Exchange (DEX)
- A way to simulate an exchange on the blockchain. The opposite is a Centralised Exchange.
- Exchange
- A venue that allows the listing and trading of financial instruments. In the crypto space the lines between a broker and an exchange are quite blurred.
- Execution
- A private message to an exchange participant notifying them of actions on their orders. Generally used for sending trade information.
- Fair Value
- The value of an asset that is considered fair given an orderly market
- Flat
- A position that has a net quantity of 0
- Floating Point Imprecision
- A phenomenon that occurs when computers have to divide two numbers in such a way that some precision is lost (eg. $1/3 = 0.333). Cumulative effects of this phenomenon can cause differences to accumulate, and lead to errors.
- Increase (a Position)
- To buy more if you are long, or sell more if you are short.
- Inventory Valuation Method
- An accounting method used to value a position, and calculate realised pnl. Some common options include First In First Out (FIFO), Last In First Out (LIFO) and Average Cost.
- Last Price
- The last traded price of a security on an exchange.
- Long Position
- To have a position as a result of a net buy.
- Long
- To have a position as a result of a net sell.
- Margin
- A type of loan brokers offer for trading.
- Mark Price
- A theoretical price at which a position is valued at.
- Mark to Market (MTM)
- A method of valuing a position at a fair price based on the market price.
- Mark Value
- The value of a position at the mark price.
- Market Data
- Public data that is broadcast from the exchange.
- Naked Short Selling
- The illegal practice of selling shares short without borrowing them first.
- Not Your Keys, Not Your Coins
- A phrase often quoted in the crypto community. It states that if you do not control the private keys to a wallet (eg. on an online service, or exchange), you do not in fact own that crypto.
- Open (a Position)
- To buy or sell when your current position is 0, or flat.
- Order Flow
- A general term for the flow of orders coming in from clients.
- Owner Of Record
- In the US, this is the official owner of a share. Having this entitles the owner to dividends, as well as voting and other benefits.
- Paper Profit/loss
- See Unrealised PnL.
- P&L or PnL
- Profit and Loss
- Position
- To be long or short a certain quantity of securities/assets.
- Position Quantity
- The net quantity of a position. Can be positive or negative depending on whether it is long or short.
- Realised Pnl
- The net cash received as a consequence of reducing or closing a position.
- Reduce
- To sell when you are long, or to buy when you are short.
- Route
- Send orders to an entity eg. an exchange, broker, market maker, etc.
- Settlement
- The exchange of cash for assets
- Short Position
- To have a position as a result of a net sell.
- Short Selling
- Creating a position such that it is profitable when the mark price goes down. In the stock market this is done by selling borrowed shares.
- Sign
- 1 if something is a buy or long, -1 if something is a sell or short.
- Unrealised Pnl
- The theoretical profit or loss if the position was closed at the mark price.