Scamwicks and Stop Cascades

Sudden and large price moves are a common feature of crypto markets, but have you ever wondered how they occur? In this article, I will break down these wicks, and go into how the phenomenon of “stop cascades” can lead to their creation.
Want to just mess about with the cascade simulator? Try it here, though I’d recommend reading this first!
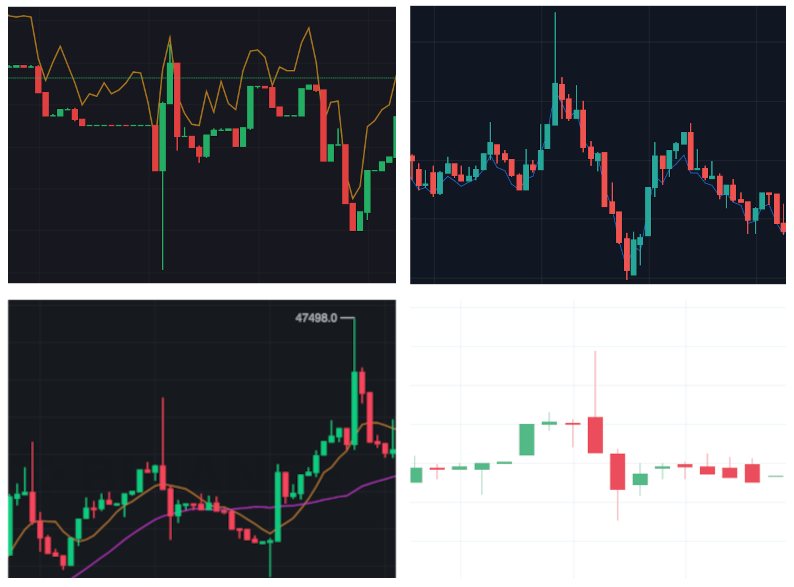
Examples of price wicks. Source (clockwise from top left): Bybit, FTX, Deribit, Binance.
Ever wonder where these come from? I am referring to the sharp and fast price moves that occur quickly, and rapidly revert back. These can be seen as “wicks” (the thin vertical lines) on the charts in the above images which were sourced from several crypto exchanges.
In the crypto world these price moves can take on a memetic nature. While small wicks occur on a daily basis, occasional large wicks often lead to feverish speculation as to their cause, and who managed to profit. With the ever underlying paranoia in the crypto community, these large wicks are sometimes called scamwicks. The implication being, that a nefarious party took advantage of the market and caused the move on purpose.
Candlestick Chart Intro
To understand price wicks, it is first necessary to understand candlestick charts. If you know this already, feel free to skip ahead to the next section.
Candlestick charts are a way of charting prices over time, and are believed to have been invented and first used some time in the late 1800’s by rice traders in Japan. They are a convenient way of tracking the trading range of an asset and quickly gauging volatility over various time periods. The chart takes the form of a series of “candles” plotted side by side on the chart axes. Each candle represents a period of time (e.g. 1 minute, 5 minutes, 1 hour, 1 day, etc.), and its shape and color indicates the trade prices that occurred during that time.

Anatomy of a candlestick.
There are four price levels represented within a candle. The open, high, low and close prices, which are sometimes shortened to OHLC. The meanings are defined below:
- Open
- The price that was prevailing (last traded) when the candle started.
- High
- The highest price that was traded during the candle’s duration.
- Low
- The lowest price that was traded during the candle’s duration.
- Close
- The price that was prevailing when the candle ended.
Candles come in two colour flavours: bullish candles occur when the close price is higher than the open price, and are coloured green. This means that at the end of the candle’s duration, the price ended up higher. Conversely, bearish candles are red (or sometimes hollow in certain styles), meaning that the close price ended lower than the open price.
Consider the following trades:
| seconds | price |
|---|---|
| 0 | 100 |
| 20 | 90 |
| 40 | 120 |
| 50 | 110 |
| 70 | 110 |
| 80 | 130 |
| 90 | 70 |
| 100 | 80 |
| 110 | 90 |
Assuming we want 1-minute candles, this results in the following OHLC table:
| minute | open | high | low | close |
|---|---|---|---|---|
| 0 | 100 | 120 | 90 | 110 |
| 1 | 110 | 130 | 70 | 90 |
The chart for these candlesticks looks as follows:

Example candlestick chart.
Traders commonly use candlestick charts to try and divine future price movements from past trading patterns via a practice known as technical analysis. Various candle patterns and shapes are interpreted as signals indicating potential future price movements, with fancy names such as “Marubozu”, “Harami” or “Hanging Man”. Evidence for the efficacy of technical analysis is… mixed, however it cannot be denied that it is a popular method of trading.
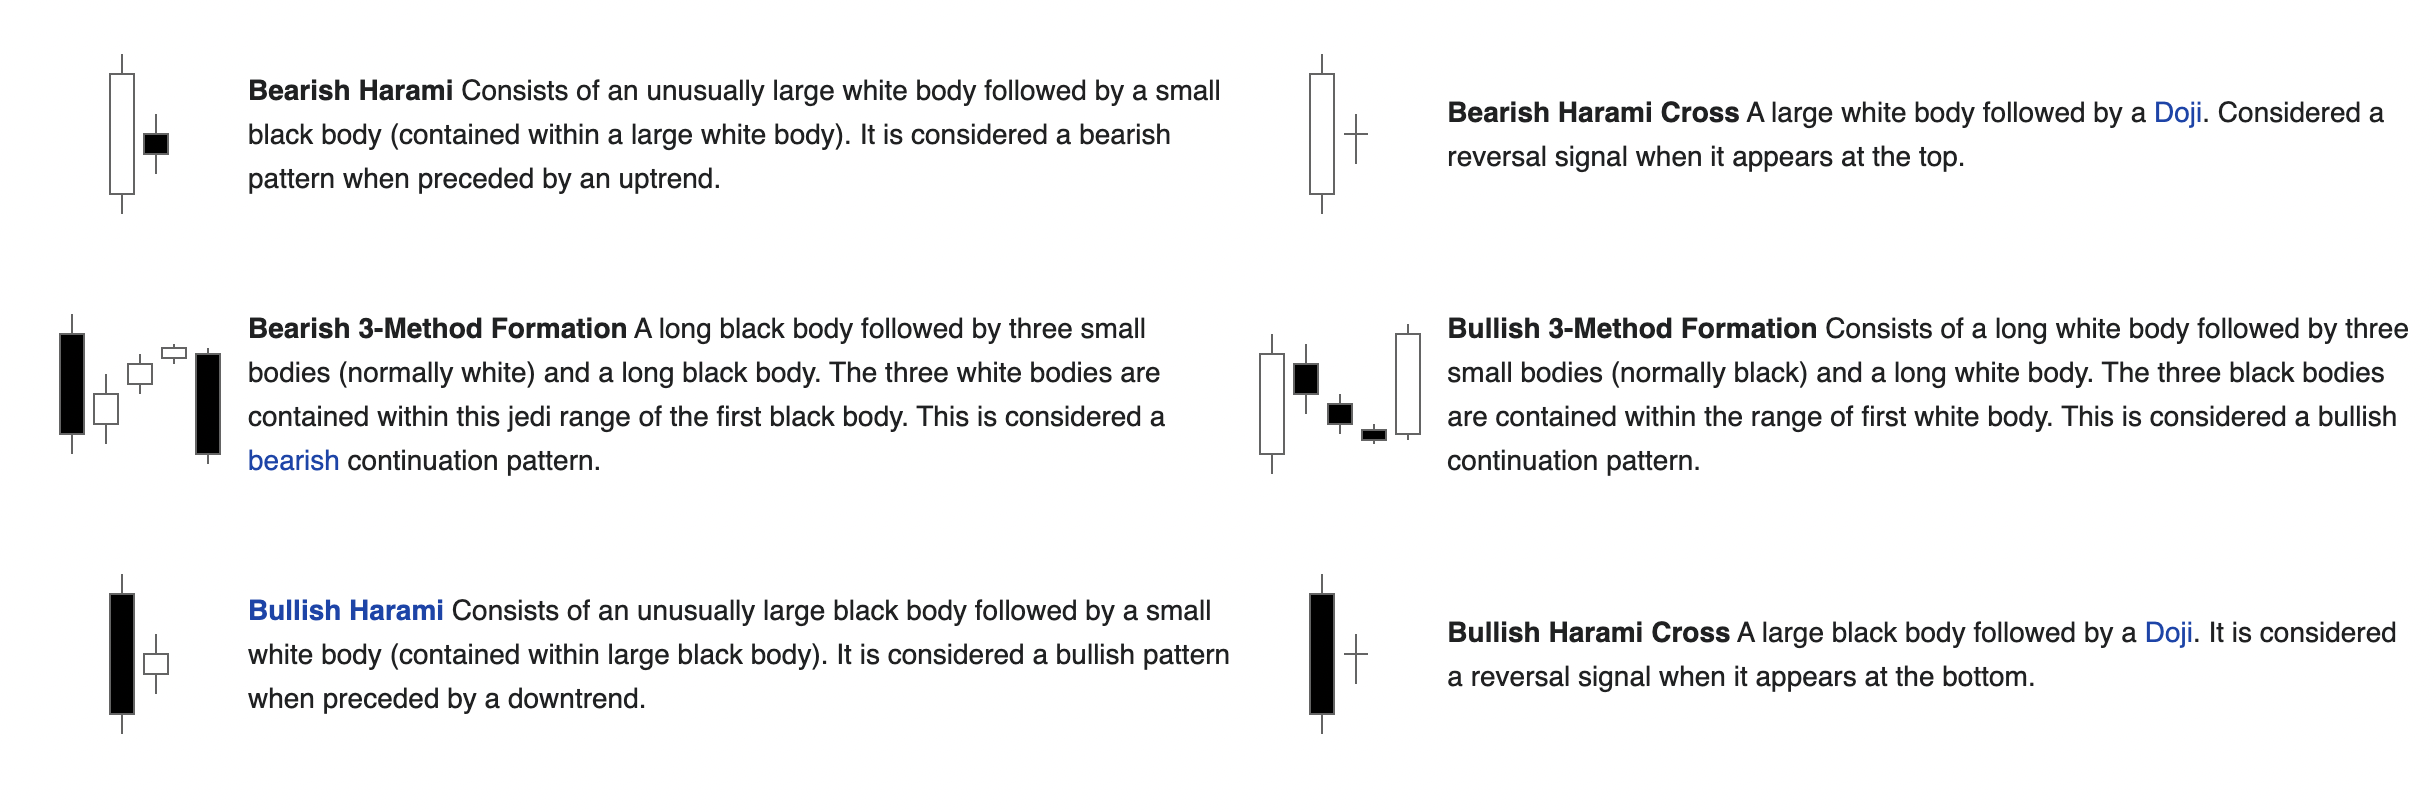
An example of candlestick patterns. Source: Wikipedia
What Are “Scamwicks”
Despite the phrase being thrown around frequently, there is no real consensus on what exactly qualifies as a scamwick.
Scamwick Up Scamwick Down!
— Jazoorrr | Degen Heroes 🏰 (@JazCrypto) June 2, 2020
Never change #Bitcoin ! pic.twitter.com/Au2NNptxUj
In lieu of this, I have my own:
As mentioned small wicks occur quite frequently, however to qualify as a “scamwick” a wick must be extraordinarily large.
The price needs to move rapidly and pull back in a short amount of time (enough to cause a wick). Typically, this would be around 1 minute.
The price movement seems to originate and be contained to only one exchange, suggesting that the cause of the move was local rather than systemic. When dealing with derivatives, the mark price does not follow the wick all the way up/down.
An example might look as follows:

An example scamwick
If you listen to twitter, you might think that this is a fairly common occurrence, though in reality most wicks are not that large and can be considered a day-to-day phenomenon. However, there have been several notable incidents where the price wicked not only a large amount, but a VERY large amount.
For instance, on the 26th of July 2021, the price of the BTCUSDT perpetual swap on Binance shot up to over \$48,000 vs a current spot price of around \$40,000. Binance later clarified that a user had placed several large buy orders exacerbating an already upwards mobile price.
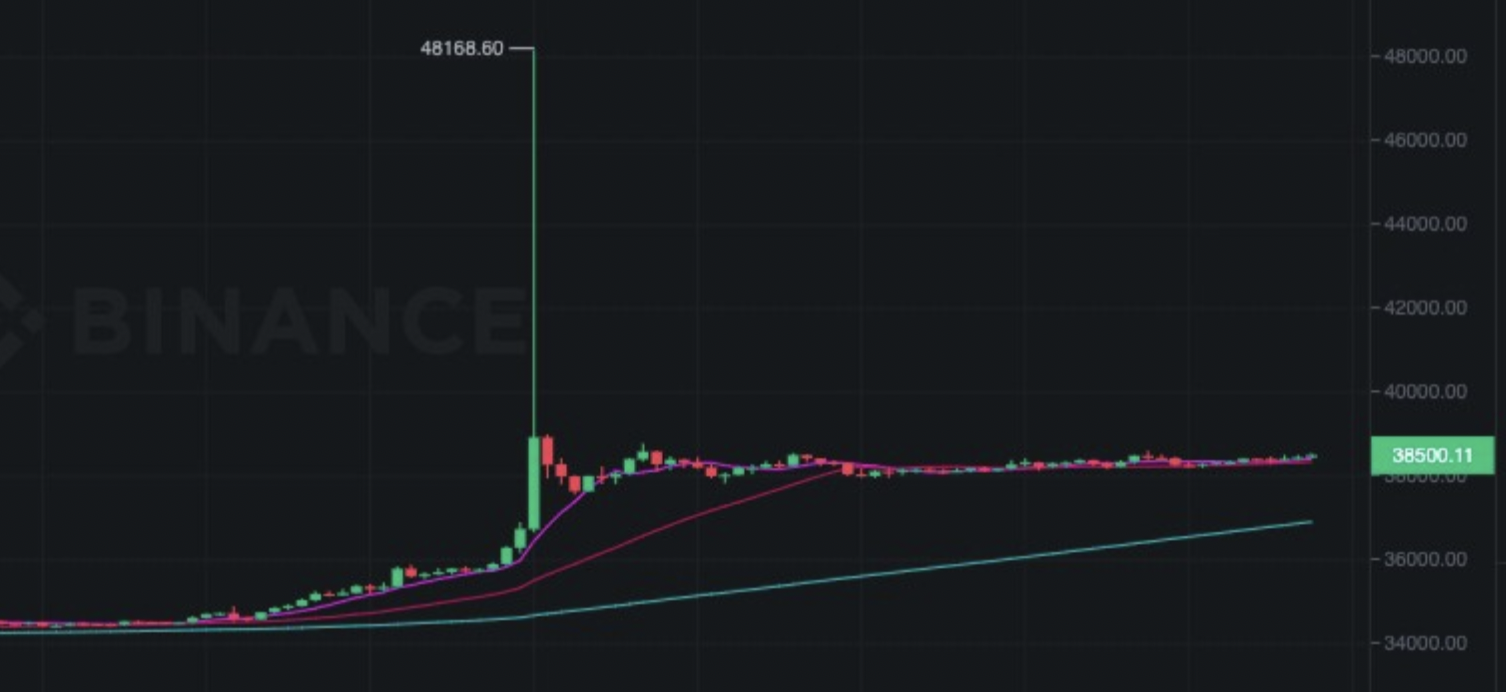
A large wick on Binance
How Wicks Form
Naturally there are many ways in wicks form, however commonly several things are required. These are not the only way moves can occur, but they are a common pattern.
1. Liquidity Environment
In order for a price wick to form, a suitable environment is required. In a previous article we discussed how order books have impact prices, and how these prices represent the highest/lowest price that will be achieved with a market buy/sell order of a certain size.
In a high liquidity environment, the difference between the best bid/ask and the impact bid/ask (often called slippage) will be low, as the book has a lot of liquidity available to absorb orders. Conversely, in a low liquidity environment the ability to absorb large orders is diminished, and such orders will have very large slippage (and therefore larger price moves). Price wicks are more likely to form in low liquidity environments, due to this fact.
2. Initiation
An initiation event occurs, which typically is a large order of some kind. Liquidity on one side of the book is rapidly taken, leading to a rapid move in the last traded price (last price). If the liquidity in the book is low, the drop in the last price can be significant just from this event.
Such orders are sometimes accidental, such as an incident which occurred on Binance on the 21st of October 2021 where the Bitcoin price wicked down from around \$64,000 to \$8,000 in under a minute. Subsequent investigation by Binance attributed the wick to the following:
One of our institutional traders indicated to us that they had a bug in their trading algorithm, which appears to have caused the sell-off that was reported this morning.
Such mistakes are not unheard of (such as the infamous Knight Capital Incident), and manual order mistakes can also occur (such as adding an extra “0” to an order). In the financial industry this is sometimes called a fat finger error.

Someone managed to pick up Bitcoin at \$8,000 making over 600% in unrealised profits in one trade! Source: tradingview
3. Acceleration
A large price move can cause price momentum in the same direction as the original move. There are a variety of reasons why this happens, and the below list is not exhaustive:
- Traders Following Momentum
- Momentum trading is a whole genre of trading strategies that attempt to discern when there is momentum in the price, and enter a position early before closing once the momentum runs out. A large price move can induce momentum traders to also pile in, exacerbating the move.
- Liquidity Flight
- Many of the traders who make up the bulk of the liquidity in the book are market makers. These participants try and maintain liquidity on both sides of the book, and make money on buying and selling on both sides. Market makers ideally do not wish to hold any position since they do not care about the direction of the price, only that they make the spread. If the price moves rapidly, market makers may remove some of their liquidity since they are worried that they will end up holding a position that they do not want, and therefore could lose money. This “liquidity flight” can also exacerbate price moves.
- Liquidations
- For exchanges that offer margin trading and leverage, part of their risk controls is the liquidation of positions that have fallen below their maintenance margin requirement. Depending on how the exchange chooses to close out these liquidated positions, this can contribute to the price wick. For example, consider a Bitcoin future. The mark price falls, and several long positions are liquidated. The exchange ends up holding these positions, and needs to sell them as it does not wish to hold a position. That means that as the price falls, the liquidation sell orders can also exacerbate the move.
- Stop Orders
- Stop orders are a special type of order that are only sent to the book once some price related condition is met (more info on these in the next section). They are often used in the context of closing a losing position before it is liquidated, or to prevent excessive losses automatically. As the price falls, these stop orders can be triggered and consequently start buying/selling into the book, exacerbating the move. In the following section we will be covering this specific behaviour in more detail.
4. Retracement
The market will typically rapidly revert after the big move. Usually this is because there was no real economic reason for the large price move, and e.g. other exchanges do not reflect it. Participants will quickly return back to the old pricing regime in order to keep in line with the rest of the market. This applies to both spot and derivatives markets (since they are typically marked using the spot price). Market makers (who watch the wider market closely) will also quickly replenish liquidity around the fair price.
Stop Order Intro
In this article we will be focusing how stop orders can magnify price moves given the right conditions. The following is a short intro to stop orders and their mechanics. If you are already familiar with them, then feel free to skip to the next section.
When trading an asset, traders may want to make sure that if their position starts losing money they can quickly cut their losses, and close it. Likewise, if a position is profitable, traders may want to close their position and take profits while the going is good. When trading derivatives, there is also the possibility of liquidation to contend with, and traders may wish to close their position before it gets liquidated, and their maintenance margin potentially lost.
For instance, take a trader with a 1 BTC long position that they entered at \$40,000. The current price of Bitcoin is hovering around \$40,000 also. They want to do the following:
- Close the position if the price of Bitcoin falls to \$36,000 (a loss of 10%).
- Close the position if the price of Bitcoin rises to \$48,000 (a gain of 20%).
You might think they could achieve this using limit orders, however this is only possible for the second point, as placing a limit sell order at \$36,000 in a market that is trading around \$40,000 will almost certainly result in an instant fill and the position being closed around \$40,000. Placing a limit order can also give away the size of your position, and your willingness to sell which in a large enough size could affect the market.
Broadly there are two types of stop order (though the naming can be confusing). For scenario 1 in the example above, there are stop loss orders. For scenario 2, there are take profit orders. These orders are not placed in the order book, but instead are managed by the broker/exchange. A stop order will have a stop price or trigger price which is a price level at which the order will be triggered. Once an order is triggered, it will be placed into the order book. In the example above, the user would set a 1BTC stop sell order at \$36,000, and a take profit order at \$48,000.
Depending on the broker, a stop order may trigger on a variety of different reference prices. Below is a (non-exhaustive) list of possible reference prices that stop orders can use:
- Last Price
- The last traded price of the instrument.
- Index Price
- In derivatives, the price of the underlying spot market index for the instrument. E.g. For a BTC/USD derivative, this would be the index of the spot market price of several spot exchanges.
- Mark Price
- In derivatives, the fair price of the contract being traded. This will often be a combination of the underlying index and the market price. This is the price on which contracts are liquidated.
The triggering of a stop order depends on whether it is a stop loss or a take profit order, and also on its side (buy or sell). The below table outlines what is the trigger condition required for each type and side:
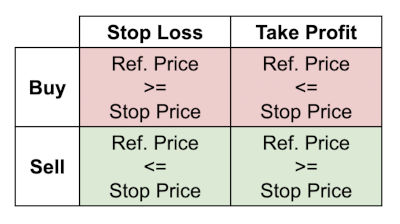
Reference Price vs Stop Price triggering conditions for stop order types and sides. Colours indicate position direction.
In addition, stop orders can either be Limit or Market orders (sometimes called stop limit and just stop orders respectively). A stop limit order will additionally have a limit price specified. When triggered it will be placed into the book just like a normal limit order. If a stop market order is triggered, it will go into the book like a normal market order, filling at any price available.
Stop Cascades
As mentioned previously, stop orders are not visible in the order book. They are instead managed by the exchange, and only triggered once the reference price reaches the stop price. By definition, unless you are the trader that placed the stop order, you do not see their positioning or their sizes within the book.
The goal of stop orders for most traders is to try and exit a position as quickly as possible if the price moves against them. Market stop orders can be a good choice as these allow the trader to virtually guarantee closing a position (though with the attached price and slippage risk). Triggering on the last price is also useful as (unlike the index or mark price) this is a price that is likely to be tradable. One other thing that we will assume here is that when a stop order is triggered, it is instantaneously placed into the book (this is not always the case however, as we will see later).
The following animation shows an example scenario on the bid side of the book (buy orders). The top part shows the level 2 volume at different price levels on the bid side, with the implied best bid being at 100. The bottom chart shows the last traded price over time. This example highlights what can happen if the right arrangement of stop orders is triggered by an aggressive order.
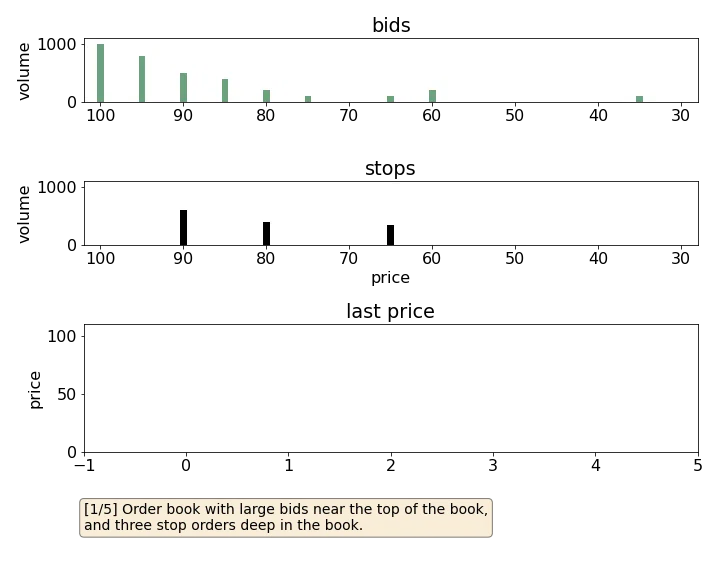
Notice that as the price falls, the stop orders are triggered. Once a stop order is placed into the book, it is large enough to trigger another (deeper) stop order, which triggers another and so on. The result of this is a cascade of market orders which rapidly remove liquidity from one side of the book, at the same time causing the last traded price to plunge.

In some ways this can be viewed similar to a chain of dominoes. A flick (initial large aggressive order) can cause a chain reaction if the dominoes are close enough (low liquidity in the book) and if the dominoes are tall enough to reach the next one (the size of the stop orders).
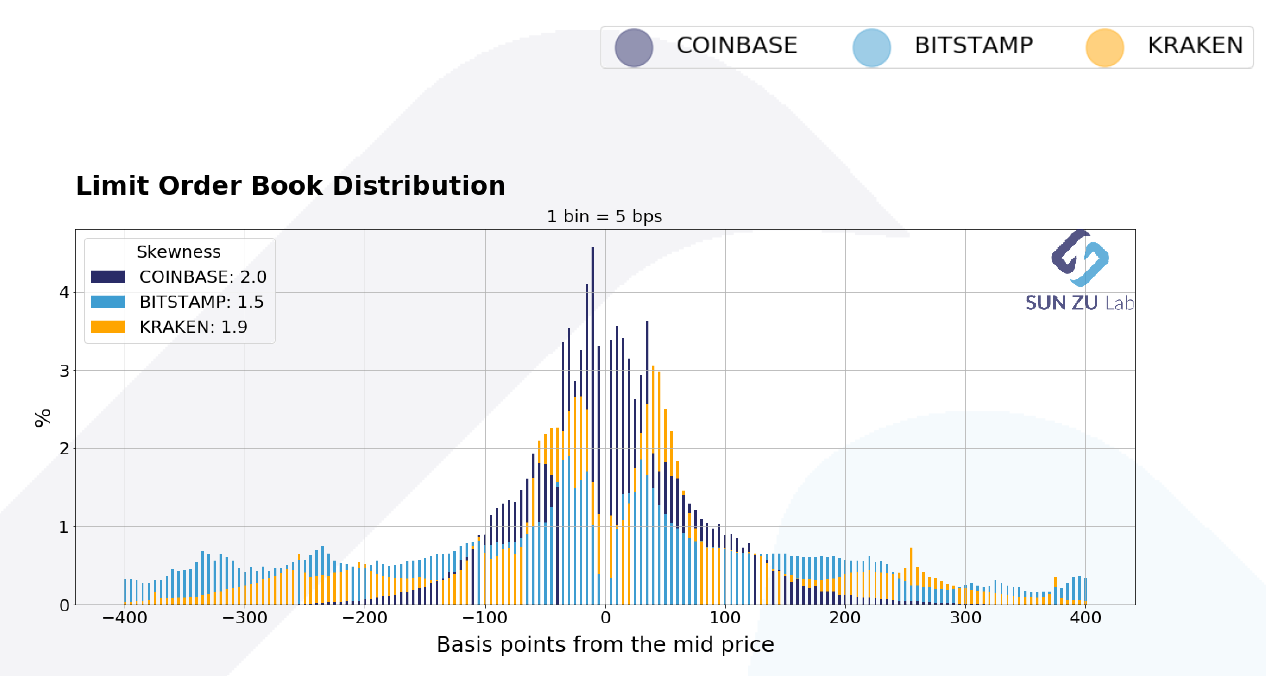
Distribution of liquidity relative to mid-price over several spot exchanges. Source: Sun Zu Lab
Like in the example above, order books often exhibit a liquidity distribution that is high near the best bid/ask and falls off rapidly deeper into the book. If this bulk of liquidity is breached by either a large order or due to liquidity flight, then the “soft underbelly” of deeper low liquidity becomes exposed. At that point the price can move extremely rapidly, especially since stop orders may be present throughout this area to protect positions from liquidation.
It is important to note however, that stop cascades are just one of many (some inscrutable) reasons as to why prices can move quickly.
Factors Affecting Stop Cascades
Liquidity
For an exchange, liquidity is one of the most important metrics just after volume. Stop cascades are much more likely to occur when there is limited liquidity to support sudden large orders, or stop triggers. Exchanges are aware of this, and many will offer incentives to market makers in order to provide liquidity and mitigate slippage. This can range from basics such as maker rebates, to market maker programs which are a full suite of incentives and obligations for providing liquidity.
Stop Order Composition
Stop cascades occur most easily when market orders are used. This is because a market order will attempt to fill the entire order quantity, irrespective of how bad the price is. This order type is popular however because traders are worried that by the time their stop order is placed in the book, the market may have run away from any theoretical limit order they may have placed.
Choosing to trigger on last price can exacerbate cascades since as the price falls, further stop orders are triggered causing a feedback loop. As pointed out in the tweet below from BitMEX after a price wick on their XRPUSD perpetual swap, alternatives such as choosing mark price or index price can be useful in avoiding being triggered by a stop cascade. This is also worth noting since for derivative products, the mark price is usually the only price that can actually liquidate you!
Last Price-triggered stops are vulnerable to fast market moves. A Stop Market executes the whole order at best available price. Stop Limits limit execution price, but may not fill the whole order; Fair or Index Price triggers aren’t directly affected by the Last Price.
— BitMEX (@BitMEX) February 14, 2020
As a consequence of this, BitMEX added an additional feature for stop orders called LastWithinMark. When set, the stop order will only trigger once the last price reaches its stop price, AND is also within 5% of the mark price. This prevents stop orders from being triggered due to the last price diverging wildly from the mark price during a cascade.
Stop Order Activation Behaviour
Depending on how stop orders are managed, there may be some latency between when the price reaches the stop price, and when the stop order itself is actually placed into the book. The rate/delay at which this happens can affect how the cascade proceeds. If all stop orders trigger instantaneously then there will be little time for liquidity to replenish, however traders will quickly get out of their position. If the delay is too long, then there may be more liquidity, but traders may not get out of their position fast enough during a legitimate move.
Price Bands & Order Limits
Another strategy for limiting price wicks is to limit the movement of the price itself. For instance, FTX prohibits orders that are more than 10-20% away from the mark price. In addition, they prevent aggressive orders from going too far through the book in one go. Such methods can be effective, though they are viewed as controversial by some who view that prices should be able to move freely without constraint. Indeed, if limits are set too tight, this can mean the exchange can get out of sync with the rest of the market if the price moves quickly for a legitimate reason.
Try It Yourself!
I’ve put together a small simulator that shows how stop cascades can play out. You can try it here, without actually crashing the crypto market :).
The simulation itself runs a fake order book with a market maker that both places passive and occasional aggressive trades. These follow the Beta distribution meaning that liquidity is concentrated near the mid-price. Try placing a series of stop orders, and see how a single market order can cause a cascade of stop orders to crash the market.
Edit Apr 2023: Cleaned up links
Glossary
- Bearish Candle
- A candle where the close price is above the open price
- Bullish Candle
- A candle where the close price is below the open price
- Candlestick Charts
- A type of chart commonly used for displaying trading ranges for financial instruments
- Fat Finger Error
- An error where a value was entered incorrectly. e.g. an extra “0” added to a trade quantity
- Last Price
- The last traded price of an instrument
- Market Maker Program
- A scheme of incentives and obligations that exchanges provide to market makers to encourage liquidity
- Momentum Trading
- A strategy where traders will try and buy/sell when the price increases/decreases quickly
- OHLC
- Open/High/Low/Close. A series of prices that represent a trading range within a time period.
- Prevailing Price
- The last traded price of an instrument
- Scamwick
- A large and rapid price move that quickly recovers
- Stop Order
- A type of order that enters the book conditional on its stop price being met
- Stop Loss
- A stop order that closes a position once a large enough loss has been accrued
- Stop Price
- The price at which a stop order triggers
- Take Profit
- The equivalent of a stop loss but for the purpose of taking profits rather than reducing losses.
- Technical Analysis
- A type of trading strategy that interprets current price movements to predict future price movements
- Trading Range
- The range of prices within which an instrument trades
- Trigger Price
- See Stop Price
- Triggered
- Once a Stop Order’s Stop Price has been reached, the stop order has been triggered and will be placed into the book